BIM Monitoring Dashboard
What We Solve
In many construction projects, differences between actual conditions in the field and planning models are often detected too late. Manual monitoring methods are time-consuming, error-prone, and not integrated. As a result, project delays, cost wastage, and design revisions are common. BIM Monitoring Dashboard comes as a solution to monitor progress visually and measurably, comparing actual conditions (as-built) with the design model (as-planned) automatically.
How does the BIM Dashboard Work?
The dashboard integrates data from the BIM model (as-planned) with actual data from the field (as-built), such as point clouds from 3D scans or aerial photographs, to detect differences between the design and the actual conditions on the ground. With this dashboard, the project team can see firsthand the extent to which construction work has progressed according to plan, analyze delays, and perform quality control more efficiently.
Key Benefits of BIM Monitoring Dashboard
Real-time Monitoring
Provides real-time updates on construction progress.
Early Deviation Detection
Compares field data with BIM models to detect discrepancies early.
Digital Project Documentation
Store historical construction records for future audits, reports and maintenance.
Support Fast Decision Making
Provides integrated and reliable information to support project management.
Point Cloud Registration Flow
File BIM
Collection of various documents (pdf, ppt, doc, rvt, nwd, etc.)
Dashboard Platform & Database Deploying
Build a digital platform system and database to host, manage and display all BIM information online. This stage includes the setup of the server, cloud, and main dashboard.
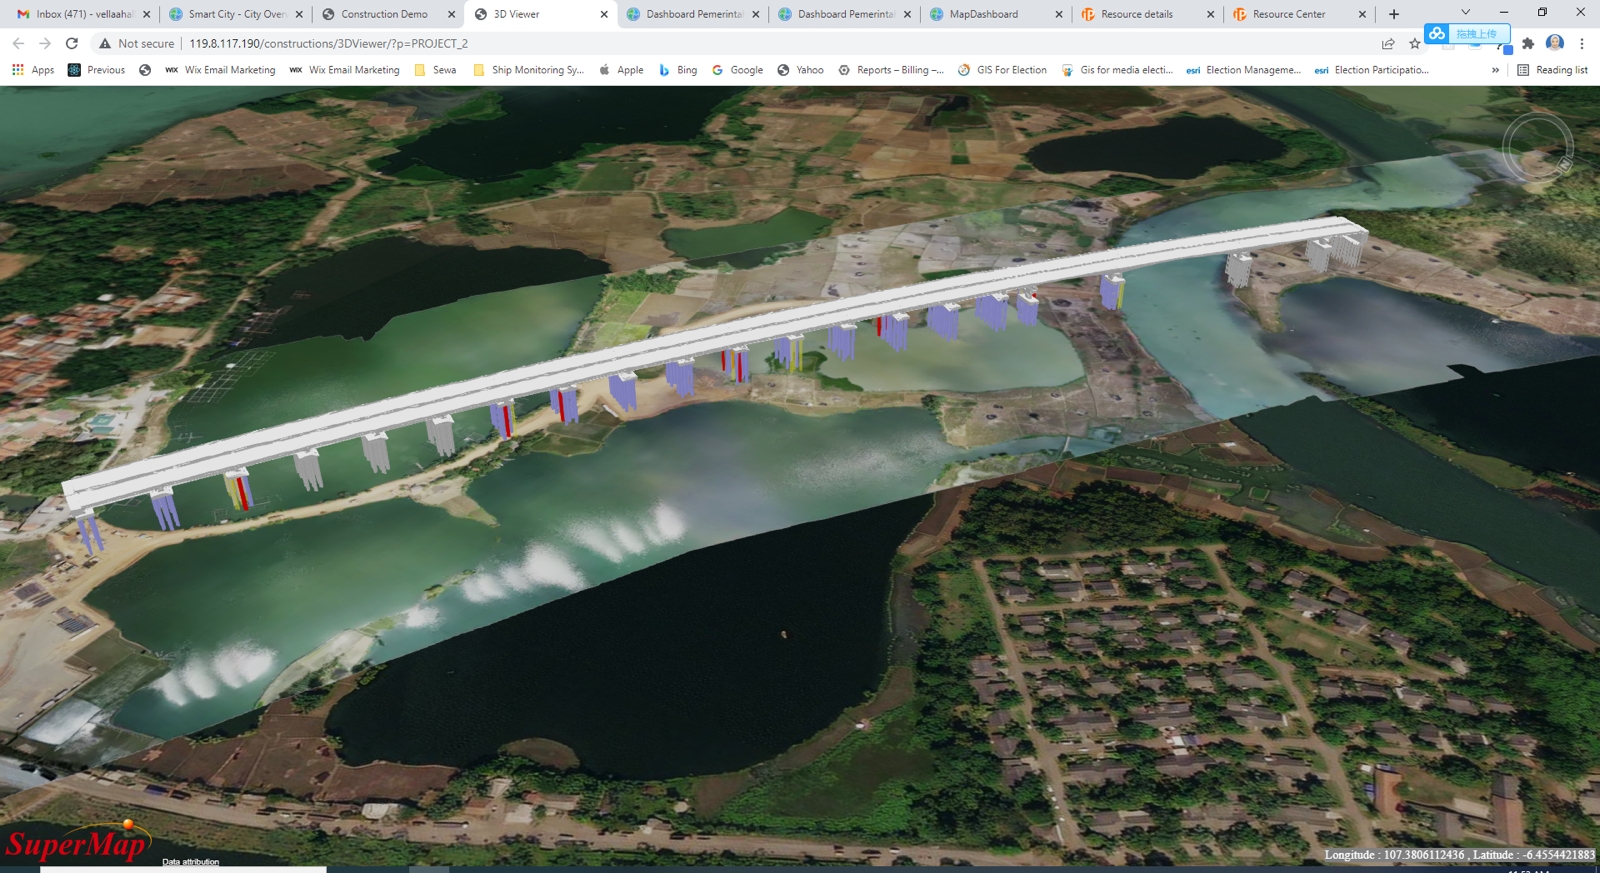
3D Model into WEBGIS Linking
The BIM model was converted and linked to a WebGIS system to make it accessible through interactive web-based maps.
Interface Dashboard Setting
Customize the dashboard interface according to project needs.
Data Management
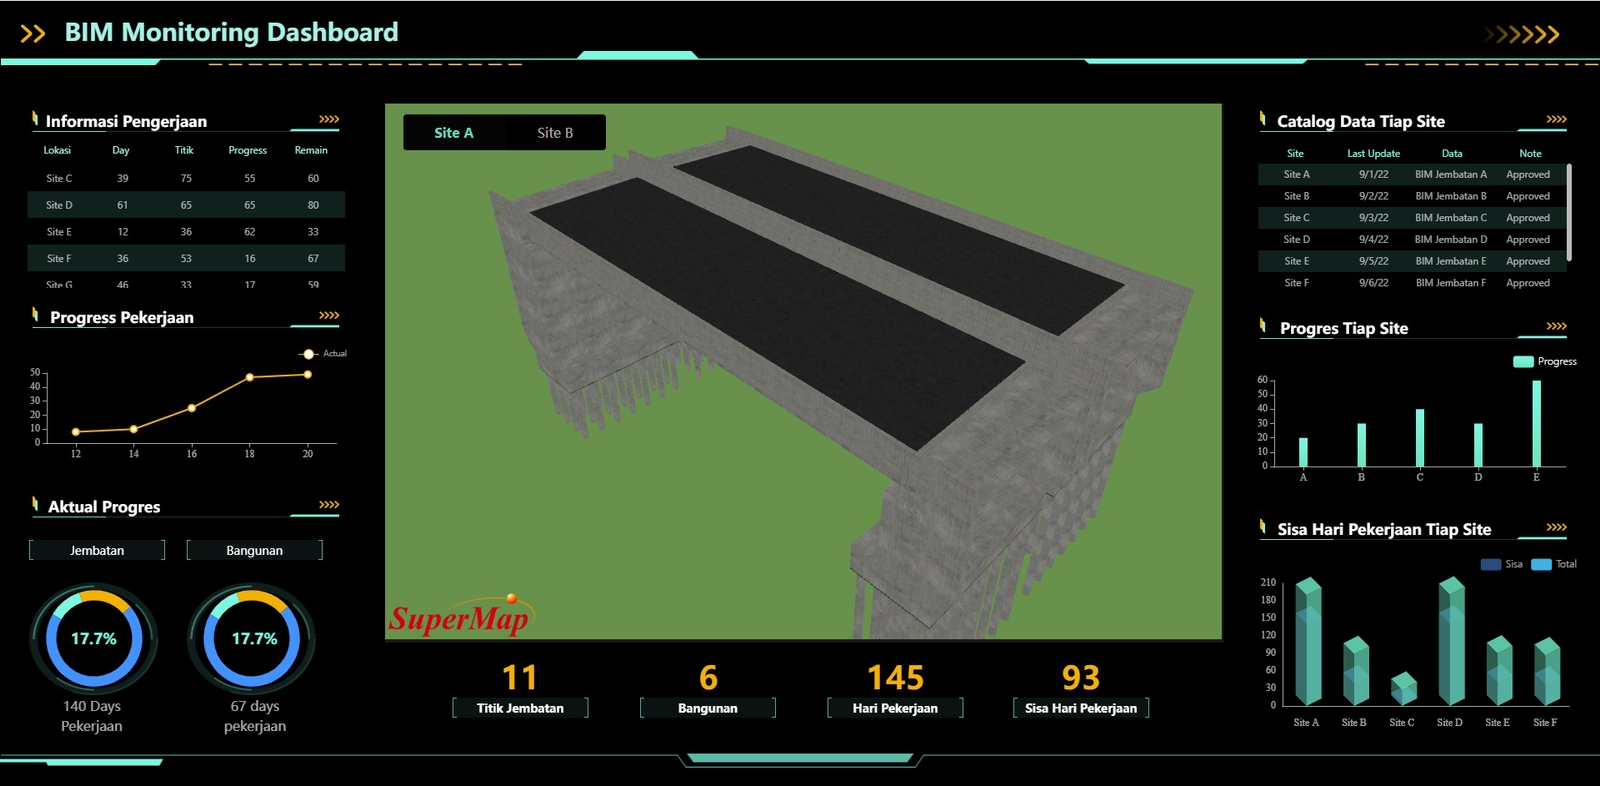
Sample BIM Monitoring Dashboard